Introduction
Predictive analytics powers critical decisions across nearly every industry. Retailers use it to forecast demand and prevent stockouts. Healthcare providers deploy it to flag patients at risk of readmission. Manufacturers rely on it to catch equipment failures before costly downtime hits.
Despite its widespread adoption, most professionals encounter predictive analytics daily without fully understanding how raw data transforms into a forward-looking forecast.
The global predictive analytics market reached $10.2 billion in 2023 and is projected to surge to $63.3 billion by 2032, reflecting a 22.4% compound annual growth rate. This expansion sits within a larger AI software spending wave that Gartner estimates will hit $297.9 billion by 2027.
The problem is that while predictive analytics appears in countless enterprise strategies, its internal logic—how historical patterns become probabilistic forecasts—remains opaque. Organizations misapply models, underestimate infrastructure requirements, or deploy algorithms that silently degrade in accuracy. This guide cuts through that: covering what predictive analytics is, how it works, and where it delivers real business value.
Key Takeaways
- Predictive analytics forecasts future events using historical and real-time data
- The process runs five stages: problem definition → data preparation → model building → validation → deployment
- Core techniques include regression, decision trees, and neural networks—each suited to different prediction problems
- Unlike descriptive or diagnostic analytics, predictive analytics answers "what will likely happen next?"
- Real-world applications span fraud detection, inventory planning, customer churn, predictive maintenance, and credit risk
What Is Predictive Analytics?
Predictive analytics is the process of using historical and current data, combined with statistical modeling and machine learning, to forecast future outcomes. It answers the question: "What is likely to happen next?" This positions it within a four-tier analytics hierarchy that defines how organizations extract value from data.
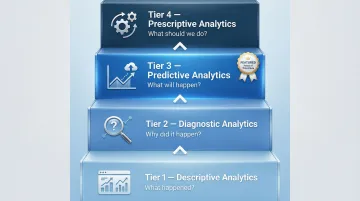
The Analytics Maturity Framework:
| Tier | Analytics Type | Core Question |
|---|---|---|
| 1 | Descriptive | What happened? (dashboards, historical reports) |
| 2 | Diagnostic | Why did it happen? (root cause analysis, pattern detection) |
| 3 | Predictive | What will likely happen? (probability-based forecasts) |
| 4 | Prescriptive | What should we do? (action recommendations) |
Predictive analytics sits at Tier 3 — it takes the "why" uncovered by diagnostic tools and converts it into forward-looking probability scores. Those scores then feed prescriptive systems that recommend specific actions. The output is never a certainty; it's an informed probability based on learned patterns in historical data.
What Predictive Analytics Is Not
Predictive analytics is not the same as reporting or business intelligence dashboards, which describe what already occurred. It does not guarantee outcomes — outputs are probabilities, not certainties. It was once the exclusive domain of data scientists, but modern low-code platforms have made predictive capabilities accessible to business analysts who understand their domain without needing deep programming expertise.
Two Core Model Categories
Predictive models fall into two primary types based on what they forecast:
- Classification models assign data to discrete categories (for example, "Will this customer churn: yes or no?" or "Is this transaction fraudulent?")
- Regression models predict continuous numerical values (for example, "How much revenue will this customer generate?" or "What will next quarter's demand be?")
The choice between classification and regression depends entirely on the nature of the business problem you're solving.
How Does Predictive Analytics Work?
Predictive analytics operates through a repeatable, structured pipeline. Each stage builds on the previous one to transform raw information into actionable forecasts. Understanding this process is essential because failures typically occur not in algorithms, but in data quality, problem definition, or deployment infrastructure.
Data Collection and Problem Definition
The process begins with defining a clear, specific prediction objective. A well-scoped problem determines what data to collect and which modeling approach is appropriate. Predicting customer churn requires different inputs than forecasting equipment failure—the former might analyze purchase history and support interactions, while the latter examines sensor data and maintenance logs.
Data sources typically include:
- Internal transactional records and CRM data
- IoT sensor feeds from equipment or devices
- External datasets (market trends, weather, economic indicators)
- Historical performance metrics
This stage involves identifying which variables are likely to have predictive power over the target outcome. Without a clear problem definition, organizations waste resources collecting irrelevant data or building models that answer the wrong question.
Data Preparation
Raw data is rarely ready for modeling. This stage involves cleaning the dataset by removing duplicates, handling missing values, and correcting errors or outliers that could skew results. Data preparation also includes feature engineering—selecting, transforming, or combining variables to make patterns more detectable.
The quality of data preparation directly determines the reliability of predictions. Poor inputs produce unreliable outputs—even the most sophisticated algorithm cannot compensate for flawed input data. Organizations that underinvest in this stage consistently produce forecasts they can't act on.
Model Development and Core Techniques
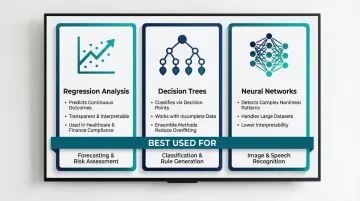
Data scientists select a modeling approach based on the problem type and dataset characteristics. Three techniques dominate enterprise predictive analytics:
- Regression Analysis — estimates relationships between variables to predict continuous outcomes. Linear and logistic regression remain foundational in regulated industries like healthcare and finance, where model transparency is a compliance requirement.
- Decision Trees — classify data by branching on decision points. Intuitive and effective with incomplete data, though prone to overfitting when used in isolation. Ensemble methods like Random Forests address this by combining multiple trees to reduce variance.
- Neural Networks — recognize complex, nonlinear patterns using multi-layer architectures trained through backpropagation. They excel at pattern recognition in large datasets but function as "black boxes," making them harder to interpret than regression or tree-based models.
In production environments, ensemble methods—combining predictions from multiple models—consistently outperform any single algorithm. Bagging, boosting, and stacking each reduce different sources of error, delivering more stable forecasts across varied conditions.
The Predictive GenAI Convergence
As modeling capabilities mature, the boundary between traditional predictive analytics and Generative AI is blurring. Netflix has moved from maintaining dozens of specialized recommendation algorithms to building a foundation model that predicts user session intent and next-item interactions in a single system. This convergence—now being called Predictive GenAI—enables architectures where a predictive model flags a high-risk customer while a generative model automatically drafts a personalized retention message.
Model Validation and Refinement
Before deployment, a model is tested on a holdout dataset it has never seen. Performance metrics—accuracy, precision, recall, and others—determine whether the model is reliable enough for business use. An unvalidated model can produce confident-looking but systematically wrong predictions, often without any visible warning signs.
Ongoing monitoring after deployment is equally important. Model accuracy degrades as real-world conditions shift away from training data—a phenomenon called model drift. Two primary forms exist:
- Data drift occurs when the statistical distribution of input data changes (e.g., sudden shifts in consumer behavior)
- Concept drift occurs when the relationship between inputs and outputs evolves, rendering the model's original logic invalid
Organizations that skip monitoring accumulate what researchers call "hidden technical debt." In financial services, regulators explicitly warn that unmonitored models lead to poor decisions, material financial losses, and reputational damage.
Deployment and Output
Validated models are integrated into operational systems. Outputs take various forms:
- Dashboards displaying risk scores or forecasts
- Automated alerts triggered by threshold events
- Recommendations embedded in business applications (e.g., CRM systems surfacing churn risk for each customer)
- API endpoints feeding predictions to downstream processes
Deployment requires reliable data pipelines to feed fresh data into the model continuously. Organizations implementing predictive analytics at scale often discover that data integration and infrastructure readiness are the true bottlenecks—not algorithmic sophistication. This is where implementation experience matters most. Vorstel Technologies helps enterprises address these infrastructure gaps directly—establishing the data pipelines, architecture decisions, and integration points needed to embed predictive capabilities into existing systems like SAP, Salesforce, or Microsoft platforms.
The practical value of predictive analytics is measured not in model accuracy alone but in the business decisions it improves—whether that's reducing churn, cutting maintenance costs, or improving inventory turns.
Where Predictive Analytics Is Used
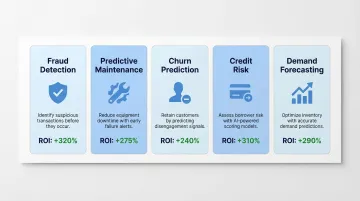
Predictive analytics delivers the highest impact where data volumes are large, operations run continuously, and the cost of being wrong — or too late — is measurable. Five use cases show verified, material ROI:
| Use Case | What It Does | Reported Results |
|---|---|---|
| Fraud Detection | Flags anomalous transactions in real time | 10–15% reduction in fraud losses; 42% of card issuers saved $5M+ over two years |
| Predictive Maintenance | Anticipates equipment failure before downtime | 50% less unplanned downtime; 40% cut in maintenance costs |
| Churn Prediction | Identifies at-risk customers for proactive retention | Netflix saved $1B+ annually; telecom providers cut churn by 4.53% |
| Credit Risk Scoring | Improves loan approval decisions | Either 7% more approvals at same default rate, or 27% fewer defaults at current volume |
| Demand Forecasting | Optimizes inventory and supply chain planning | 30%+ forecast accuracy improvement; 33% reduction in overordering |
Industry-Specific Impact
Effectiveness depends on data quality, operational maturity, and how quickly teams can act on model outputs. Retail and e-commerce extract the most value from demand forecasting and churn prediction. Manufacturing ROI concentrates in predictive maintenance. Financial services lean hardest on fraud detection and credit scoring.
Across these verticals, the pattern holds: the closer the model output is to an operational decision, the faster the return. Vorstel Technologies has implemented predictive analytics in several of these contexts — including a retail engagement where ML models trained on historical sales, seasonal trends, and promotional data replaced manual spreadsheet forecasting, cutting overstock exposure and stabilizing inventory planning.
Conclusion
Predictive analytics is not magic—it is a disciplined process of learning from historical patterns to assign probabilities to future events. Its value lies in making those probabilities actionable through timely, relevant interventions. Organizations that treat predictive analytics as a pipeline requiring clean data, valid models, and operational integration consistently outperform those that treat it as an off-the-shelf solution.
The difference between real value and wasted investment comes down to infrastructure readiness. Nearly 95% of corporate AI projects fail to deliver measurable impact because data pipelines cannot keep up with real-time demands, leaving predictive models starved of current, connected data.
Investing in the right foundation early—**a sound data architecture, continuous monitoring, and seamless system integration**—is what separates organizations that forecast effectively from those that simply collect data.
Frequently Asked Questions
What are examples of predictive analytics?
Credit scoring models predict loan default probability using financial history. Netflix recommendation engines forecast which content users will watch next based on viewing patterns. Hospital readmission risk models identify patients likely to return within 30 days using electronic health records. Retail demand forecasting predicts next quarter's sales using historical transactions and seasonal trends.
What are the main types of predictive analytics?
The two primary categories are classification models (predicting which category something falls into, such as "churn or no churn") and regression models (predicting a continuous value, such as revenue or temperature). Most real-world systems combine several model types to address different aspects of the same business problem.
What are the steps in the predictive analytics process?
The five core steps are: define the prediction problem, collect and organize relevant data, prepare and clean the data, develop and train the model, then validate and deploy. The process is iterative — models are refined continuously as new data arrives and business conditions shift.
What techniques and models are commonly used in predictive analytics?
Common techniques include regression analysis (continuous outcomes), decision trees (interpretable classification), and neural networks (complex nonlinear patterns). The right choice depends on problem type, data characteristics, and how much interpretability the business requires.
What skills are needed for predictive analytics?
Practitioners need statistical knowledge, data preparation skills, machine learning tool proficiency, and domain expertise to interpret results meaningfully. Modern low-code platforms have lowered the technical barrier, enabling business analysts to build and deploy models without deep programming expertise.
How does predictive analytics differ from other types of data analysis?
Each analytics type answers a different question: descriptive covers "what happened," diagnostic covers "why it happened," predictive covers "what will happen," and prescriptive covers "what should we do." Predictive analytics is forward-looking and probabilistic — distinct from the retrospective focus of descriptive and diagnostic approaches.